Our projects
WHATWE DO
OUR MISSION
We want to contribute to a world with open-minded and well-informed citizens. We help our clients’ audiences, expert and non-expert alike, to learn about world affairs.
OUR SERVICES
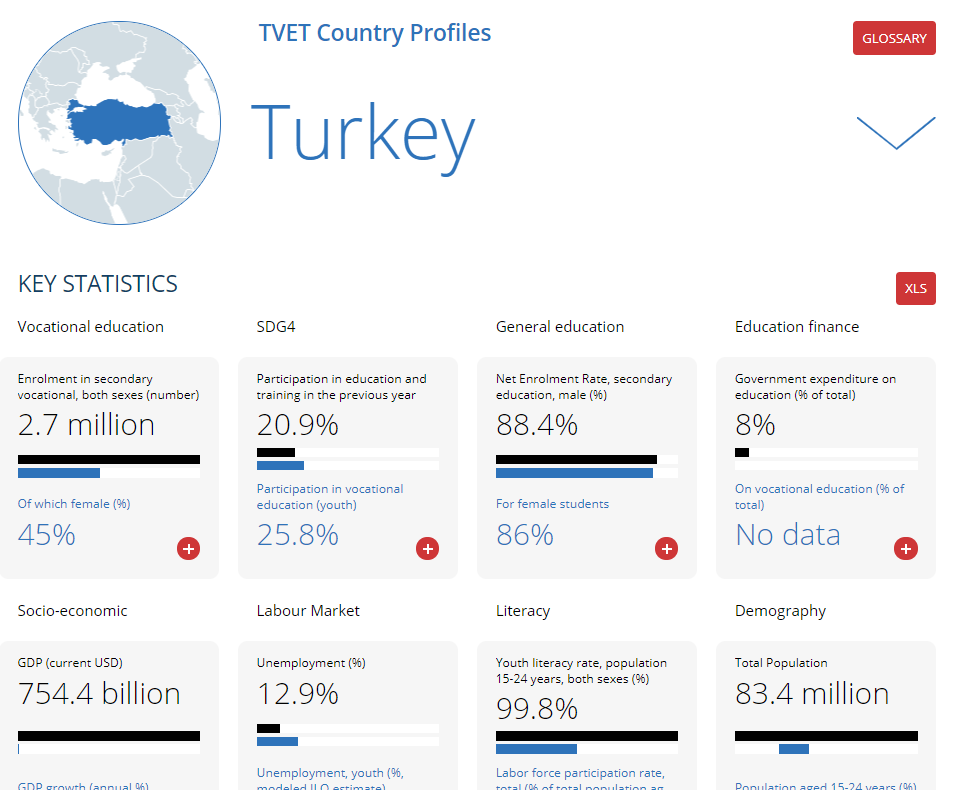
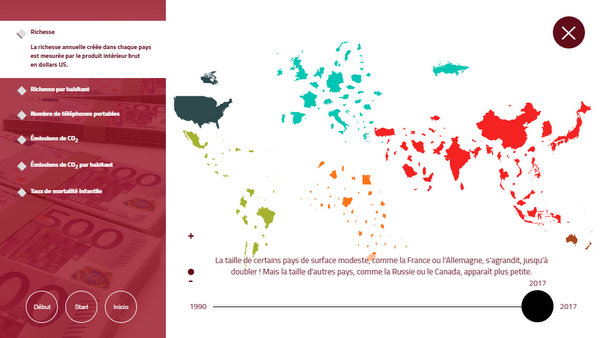
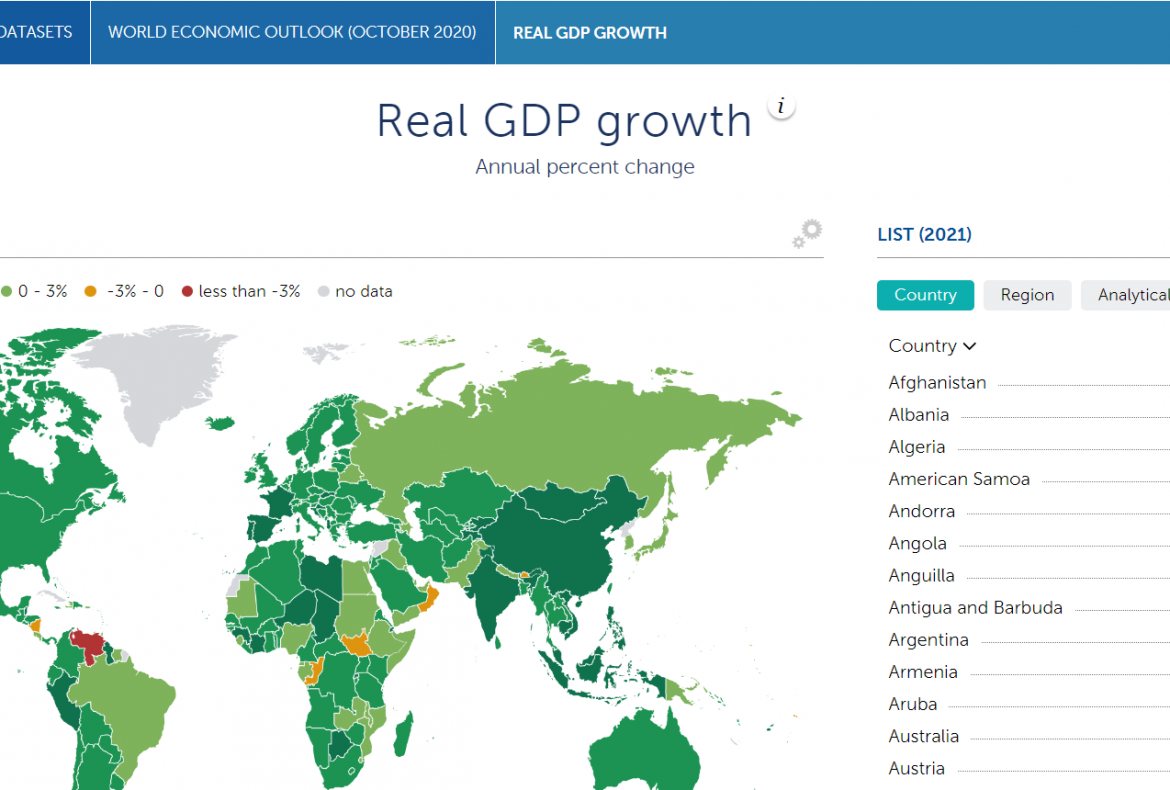
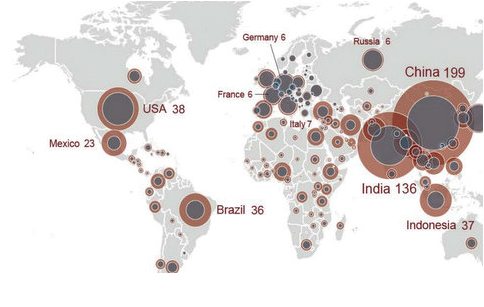
We offer web development, visual design, consultancy and journalism to help our clients present data-rich content. We develop edited maps. custom-made tools, dashboards and websites to visualize statistics and compose a narrative. With our Tellmaps system clients can easily create a branded eAtlas with rich content.
OUR CLIENTS
Our clients include international organizations (International Monetary Fund, UNESCO, International Energy Agency), knowledge institutes (International Food Policy Research Institute, World Steel Association), statistical offices (Statistics South-Africa).